Using the F&O Screener
4 min read
The F&O Screener scans 100+ NSE F&O stocks and lets you filter and sort by the metrics that matter — PCR, OI change, IV rank, volume spike and unusual activity. It is a free data tool; no AI query needed.
Read the summary cards
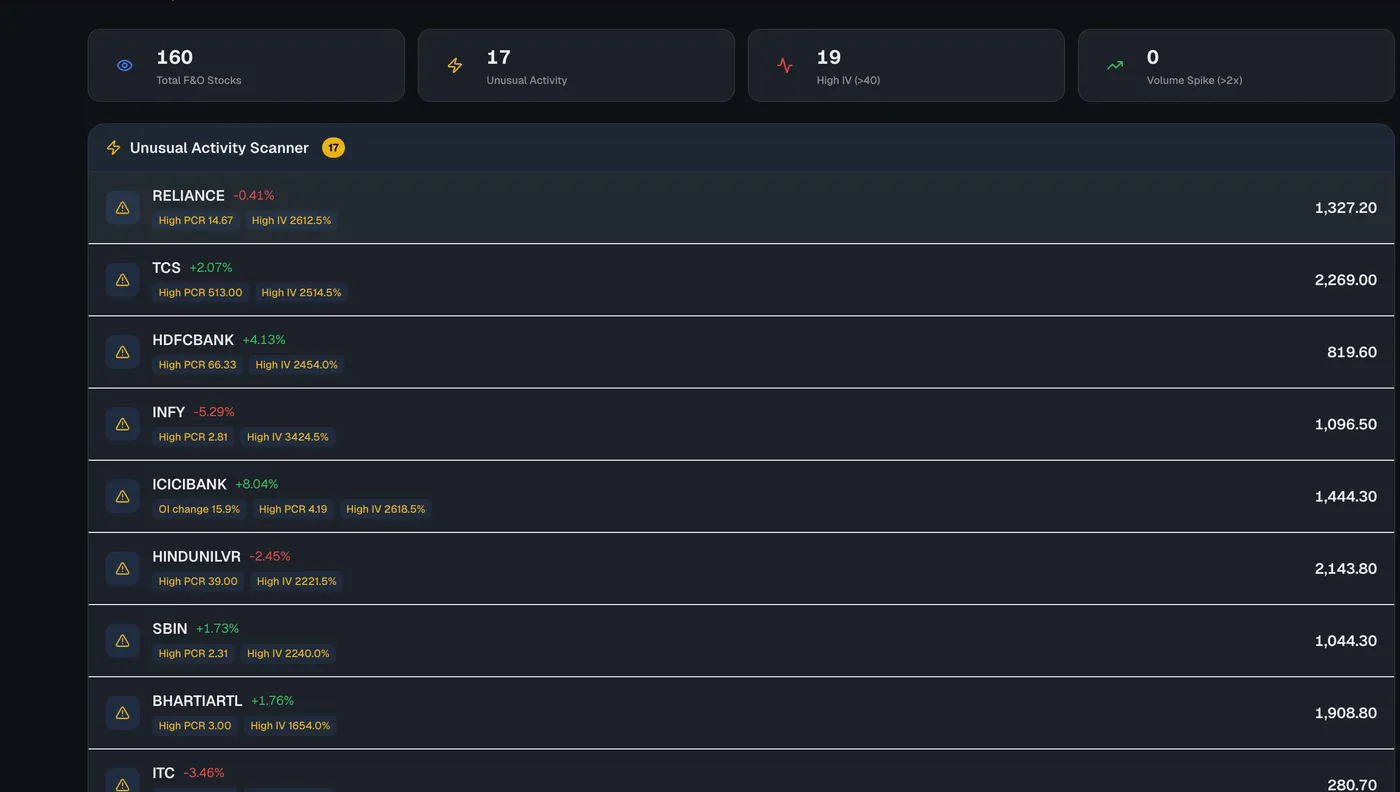
At the top, quick stat cards show the total F&O stocks scanned, how many show unusual activity, how many have high IV (above 40) and how many have a volume spike (over 2×). This is your instant read on how active the market is today.
Filter the list
- 1Open the Filter panel.
- 2Set thresholds — IV rank min/max, minimum OI change %, minimum volume spike, and PCR min/max.
- 3Tick Only Unusual Activity to see just the stocks flagged as abnormal.
- 4Use Reset Filters to start over.
Sort and drill in
Click any column header to sort — Price, Chg %, IV Rank, OI Change %, Vol Spike, PCR, OI or Max Pain. Click a row (or an item in the Unusual Activity Scanner) to open that stock’s detail page. The list paginates 20 at a time and rescans automatically every few minutes.
Unusual activity means a stock is showing two or more abnormal signals at once (for example a volume spike plus a big OI change). It is a starting point for research, not a signal to trade.
Open the F&O Screener
Scan 100+ F&O stocks by PCR, OI change, IV rank and volume.